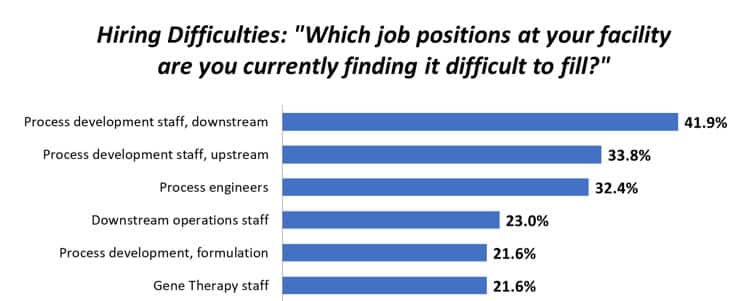
What makes it so difficult to monitor and control biomanufacturing processes?
In part, of course, it is because the processes themselves are inherently complex, involving hundreds of variables and critical process parameters that impact the processes’ critical quality attributes. The difficulty is compounded by the many, often obscure interactions between all of these variables and parameters, especially when teams must rely on manual approaches and rudimentary tools for tracking and monitoring.
Instead of tracking many interdependent variables separately, what if you had a single graphical representation that captured the overall health (both past and present) of a biomanufacturing process and reliably predicted its future health? That is just what a process monitoring tunnel provides. The upper and lower bounds of the tunnel show the maximum and minimum acceptable ranges for the principal components of the process (more on those in a moment). Process engineers can see at a glance how the process has performed until now, how it is currently performing, and how it will likely perform with respect to these bounds, enabling them to take corrective action if necessary and proactively plan for downstream operations.
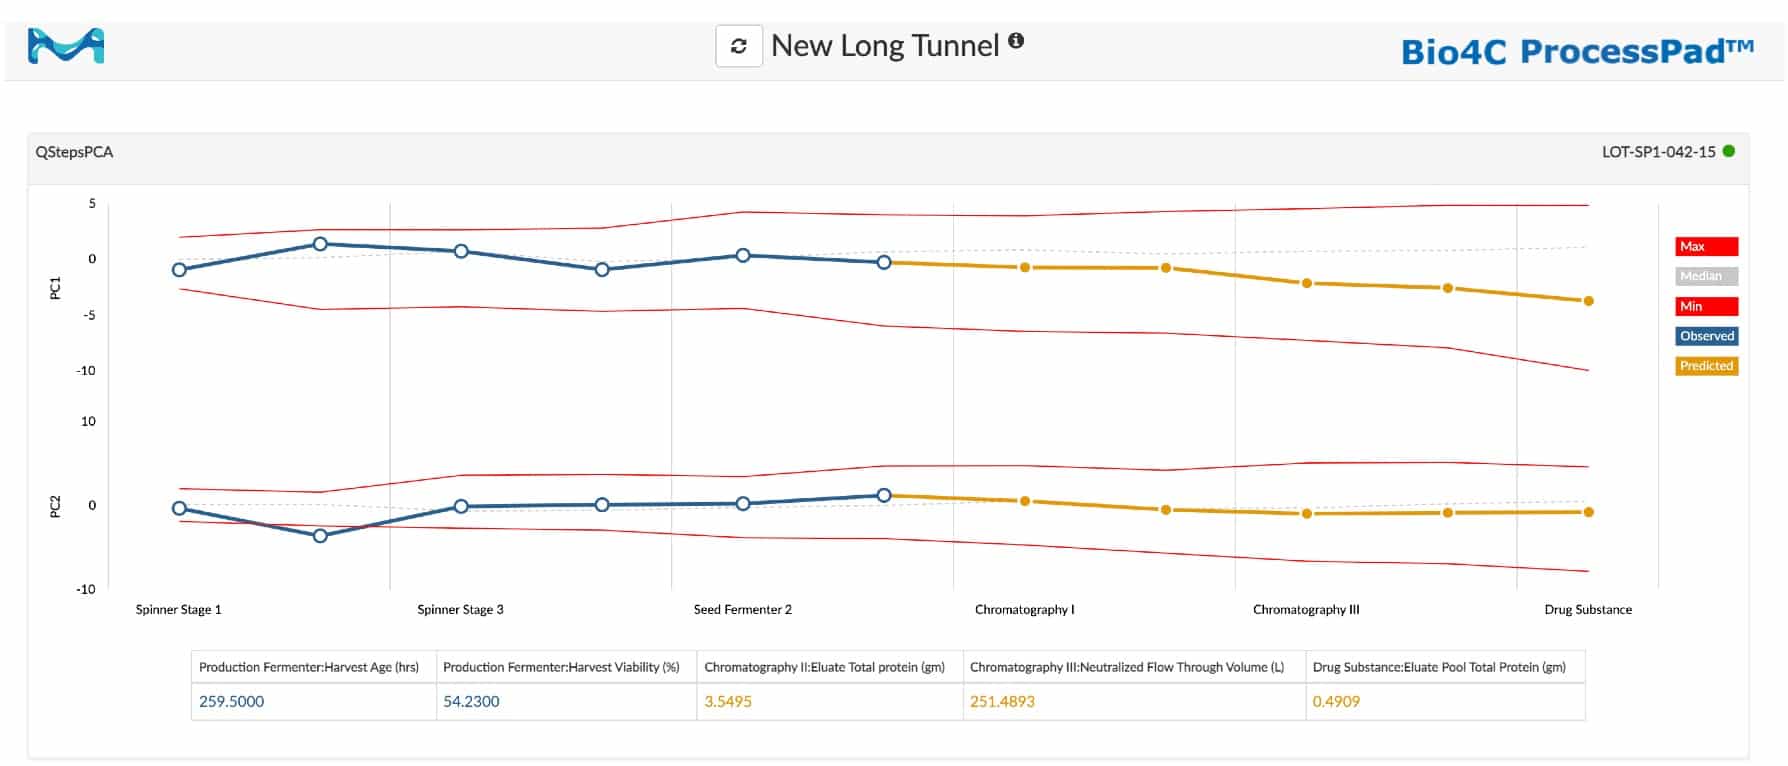
The health of a six-stage process is graphically represented in this process monitoring tunnel in Bio4C ProcessPad™ software, which highlights the minimum, maximum, mean, observed, and predicted values for principal components.
How Do Process Monitoring Tunnels Work?
Process monitoring tunnels are powered by multivariate data analysis (MVDA), a statistical technique that is often employed to unearth meaningful insights from complex, multidimensional data sets, such as those common to biomanufacturing. Among the most widely applied MVDA methods for reducing the complexity (or dimensionality) of data is principal component analysis (PCA), in which a data set with many variables is transformed into a new set with just a few variables, known as principal components, while preserving much of the information encoded by the variables. It is these principal components that are tracked in process monitoring tunnels.
Because principal components capture most of the variability of the original data set in far fewer variables, they make it easier to assess the health of a bioprocess at any given time. But how can they be used to predict process health into the future? This capability is enabled by partial least squares (PLS) regression, another MVDA regression technique that is widely used to predict future outcomes based on historical data. Process monitoring tunnels use a combination of PCA and PLS regression to support predictive analytics in biomanufacturing.
Using Process Monitoring Tunnels in Biomanufacturing
In practice, two main types of process monitoring tunnels are used for bioprocesses: inter-stage and intra-stage tunnels. Inter-stage process monitoring tunnels span multiple unit operations – for example, bioreaction, chromatography, and filtration. By comparison, an intra-stage process monitoring tunnel is focused on a single unit operation. A process engineer can, for example, monitor a bioreactor unit operation using an intra-stage tunnel that incorporates variables such as the initial cell density, cell growth rate, and protein production rate.
Of course, a process monitoring tunnel would be of limited value if it could provide only a high-level view of the process. Often, process engineers need to examine issues in much greater depth. In these instances, engineers can use the tunnel as a starting point to drill down into the underlying data and see which parameters have the most influence on the process’s current state.
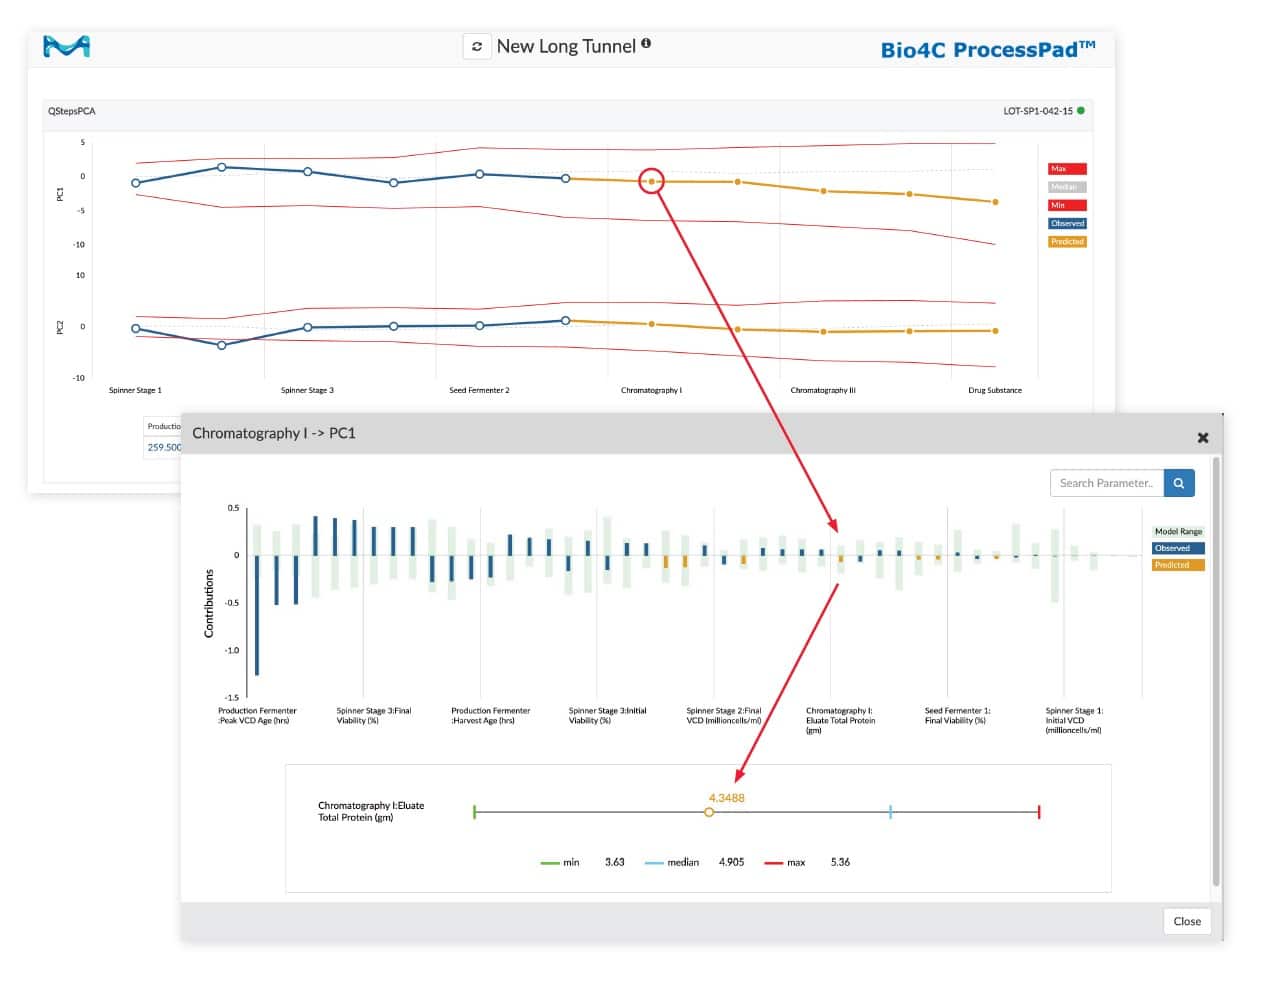
Using a Bio4C ProcessPad™ software process monitoring tunnel to drill down and examine a chromatography unit operation.
Take a Closer Look
For biomanufacturers that are already using process monitoring tunnels, the ability to monitor batch performance in near-real time is providing a key advantage. So too is the ability to identify process anomalies earlier, reduce the time need to perform root-cause analyses, and better predict quality.
To learn more about process monitoring tunnels, the MVDA techniques that underpin them, and other advantages that your organization may benefit from, see Improving Bioprocess Monitoring and Control with Multivariate Data Analysis.